On 24 April 2020, the Urban Redevelopment Authority (URA) released its final quarterly report showing a 1% drop in its Property Price Index for private residential property in Singapore. While many real estate industry insiders had expected Q1 2020 private property prices to fall by greater than the 1.2% as reported by earlier URA flash estimate, it appeared that the final figure was not as bad as first feared.
Why did this happen, and is it really any consolation? Before we dive in to our analysis, let’s have a little recap of Q1 2020.
Q1 2020: A quarter unlike any other
If you can recall, Q1 2020 encapsulates the three months during which the world swung from normalcy to pandemic and recession.
In January, Covid-19 was at most a blip on a horizon, a localised issue in China, and business as usual everywhere else.
In February, we began worrying about Covid-19’s impact on Asia, especially given Chinese consumer influence on sectors including real estate.
And March was when Covid-19 began showing up in the rest of the world; the World Health Organisation (WHO) declared a pandemic, the Monetary Authority of Singapore (MAS) confirmed a recession, and normal life gave way to social distancing.
So it’s fair to say that Q1 2020 is an exceptional one given the Covid-19 outbreak, both for the economy and the real estate market.
Analysing Q1 2020 Property Price Index vs Flash Estimate
The URA flash estimate, as the term implies, is a preliminary estimate of the quarterly Property Price Index that’s typically released three weeks after a quarter ends. The three-week delay in the release of the final quarterly figures is because of the time it takes for caveats of property transactions to be filed.
Usually, the flash estimate is forgotten and ignored once the final Property Price Index and accompanying statistics are released.
For Q1 2020 however, we felt that we should take a closer look at the flash estimates.
But why?
The reason: By comparing URA’s flash estimate figures with the final statistics for Q1 2020, we can find out how the worsening Covid-19 situation in March impacted the private property market.
This is because flash estimate numbers omit a big chunk of the transactions that happened later in the quarter (March, in the case of Q1).
And by comparing final figures versus the flash estimate, we can observe how prices in the different segments in the Singapore property market performed in the extraordinary month of March 2020.
Here’s the comparison:

Finding: Not all condos have been impacted in the same way by Covid-19
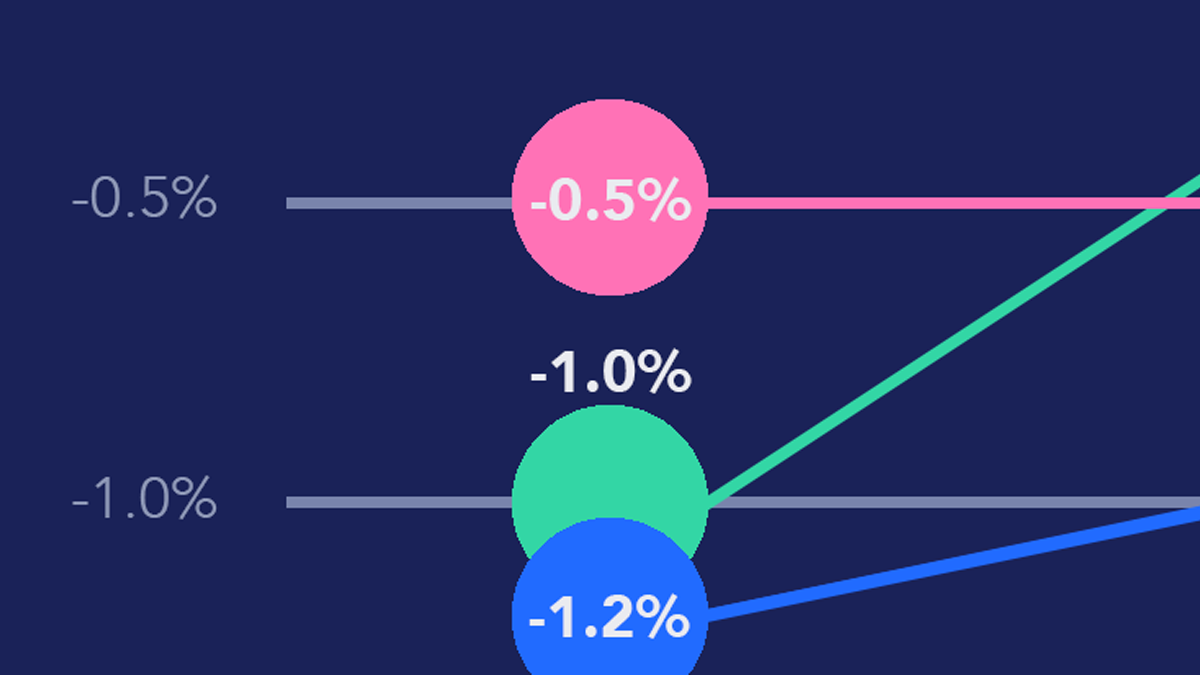
As the chart above shows, prices of private residential properties in the Core Central Region (CCR) fell further—from -1.5% to -2.2%—when we took into account transactions in mid and late March. Meanwhile, property prices in the Rest of Central Region (RCR), which includes areas like Paya Lebar, Marine Parade, Pasir Panjang, Thomson and Bishan, remained constant at 0.5%.
Surprisingly, private residential properties in the Outside of Central Region (OCR), which includes mostly mass-market condos, saw prices ‘rebound’ from a -1.0% drop to a -0.4% drop.
The stark difference in the change of CCR private residential prices compared to other region is expected, given that a large chunk of demand for those properties are from foreign buyers, who have mostly put their buying activity on hold due to the global lockdowns and uncertainties surrounding the economy.
Meanwhile, in the OCR, we saw prices move in the opposite direction compared to the CCR. Associate Professor Sing Tien Foo, director of the National University of Singapore’s Institute of Real Estate and Urban Studies, told 99.co that while “buying for investment may slow down, those who need a roof over their heads will probably still need be in the market to find houses in preferred location.”
OCR properties are typically bought by buyers for their own stay and, in Q1 2020, such home buyers may have be tempted to move quickly to secure their units of choice, especially with low home loan interest rates on offer. Moreover, the Covid-19 situation was less severe back then, and sentiment among non-investors was relatively unaffected.
But you might ask: OCR prices cut its drop by 0.6%, but CCR prices fell an additional 0.7% compared to the earlier flash estimate. So, shouldn’t the final Q1 2020 Property Price Index have fallen further?
Prices in the OCR exerted a bigger effect on the Property Price Index in March 2020
Now, it’s important to note that the calculation of the overall URA Property Price Index (including the CCR, RCR and OCR) isn’t just based solely on the price of transactions. It’s also based on the volume of transactions.
As the following month-to-month graph by 99.co shows, the volume of CCR transactions dropped off sharply in March 2020, as volume of OCR transactions continued to increase. This decreased the CCR’s influence on the overall Property Price Index, even as average per square foot (psf) prices for prime district condos plummeted -11.5%.
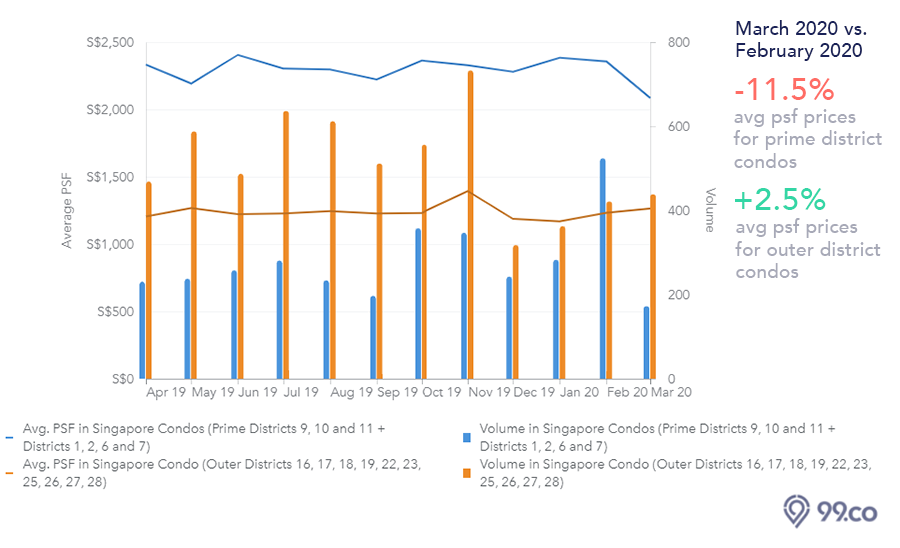
The performance of the OCR is the reason why URA’s Q1 2020 Property Price Index was ‘not as bad’ as earlier flash estimates.
It’s fair to say that OCR sales shored up the URA Property Price Index in March 2020. Looking ahead, two things will be pivotal to the performance of property prices moving forward: the volume of transactions in the OCR and home prices in the OCR.
A drop in OCR prices and transaction volume will accelerate the drop of the URA Property Price Index in the coming quarters, and there is little doubt about that.
Due to the circuit breaker measures from 7 April to 1 June, it is highly likely that Q2 2020 will be characterised by a massive dropoff in transaction volume across all segments.
And, in three months’ time, we could be looking at a steep decline in the URA Property Price Index if sentiment among mass-market, for-own-stay buyers— the bulk of buyers for OCR properties—turns sour.
Do you agree with our analysis? Share your thoughts in the comments section.
If you found this article helpful, 99.co recommends Will rent go down in a recession? and The truth behind “declining” condo sales volume in March 2020
Looking for a property? Find your dream home on Singapore’s largest property portal 99.co!
About Kyle Leung

Content Marketing Manager @ 99.co

Looking to sell your property?
Whether your HDB apartment is reaching the end of its Minimum Occupation Period (MOP) or your condo has crossed its Seller Stamp Duty (SSD) window, it is always good to know how much you can potentially gain if you were to list and sell your property. Not only that, you’ll also need to know whether your gains would allow you to right-size to the dream home in the neighbourhood you and your family have been eyeing.
One easy way is to send us a request for a credible and trusted property consultant to reach out to you.
Alternatively, you can jump onto 99.co’s Property Value Tool to get an estimate for free.
If you’re looking for your dream home, be it as a first-time or seasoned homebuyer or seller – say, to upgrade or right-size – you will find it on Singapore’s fastest-growing property portal 99.co.
Meanwhile, if you have an interesting property-related story to share with us, drop us a message here — and we’ll review it and get back to you.
Join our social media communities!
Facebook | Instagram | TikTok | Telegram | YouTube | Twitter





Leave a comment