I knew a family who once lived at the Botanic Gardens Mansion apartment at Taman Serasi. Their flat was just 500 metres (7-minute walk) to Botanic Gardens and they’re next door to Gleneagles Hospital.
Eventually, having grown fond of the neighbourhood (familiar food and entertainment haunts, family doctor, etc.), they sold the property and moved into a landed home in the nearby Maryland Estate GCB Area.
So it’s not far-fetched to conclude that there’s a select group of buyers for condos/ apartments in the fringes of GCB estates who someday aspire to own a bungalow or landed home nearby.
Not only that, there are ultra-high-net-worth individuals who own a GCB in the area who may want a second home, preferably a full-facility condo or serviced apartment nearby. Not every GCB homeowner wants to return to a big, empty house every night, right?
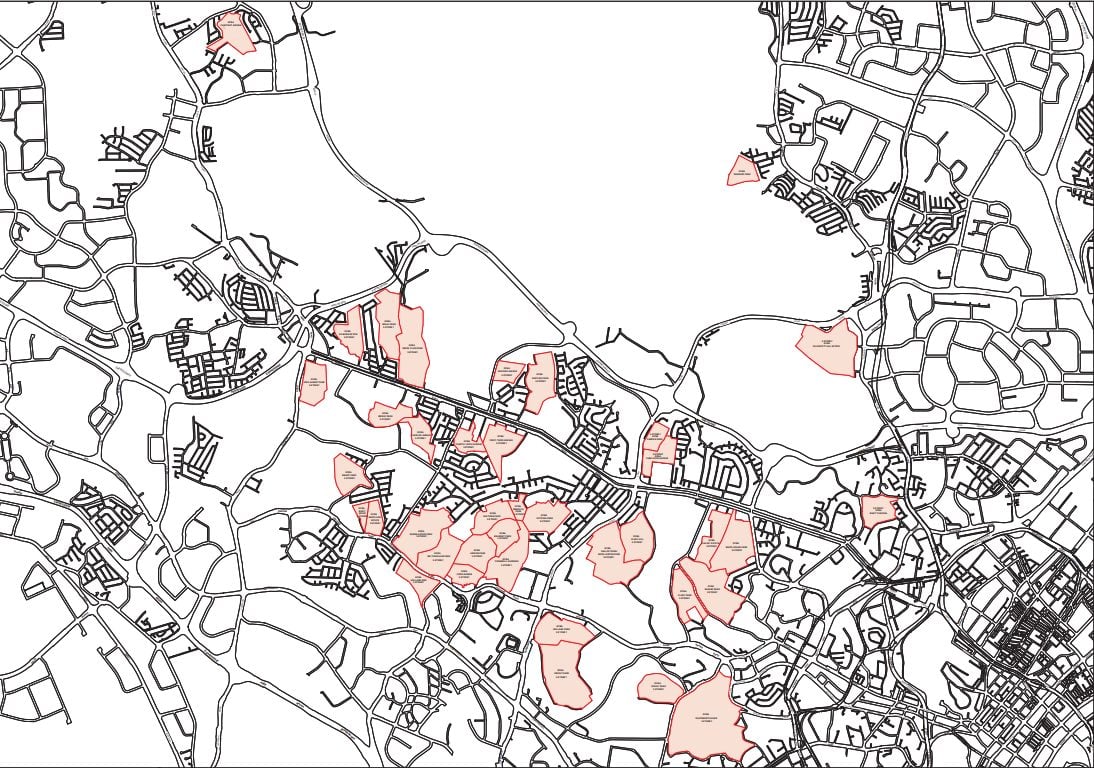
In Singapore, there are only 39 GCB Areas (GCBA), most of which are concentrated around the Dunearn/ Bukit Timah/ Holland Road areas.
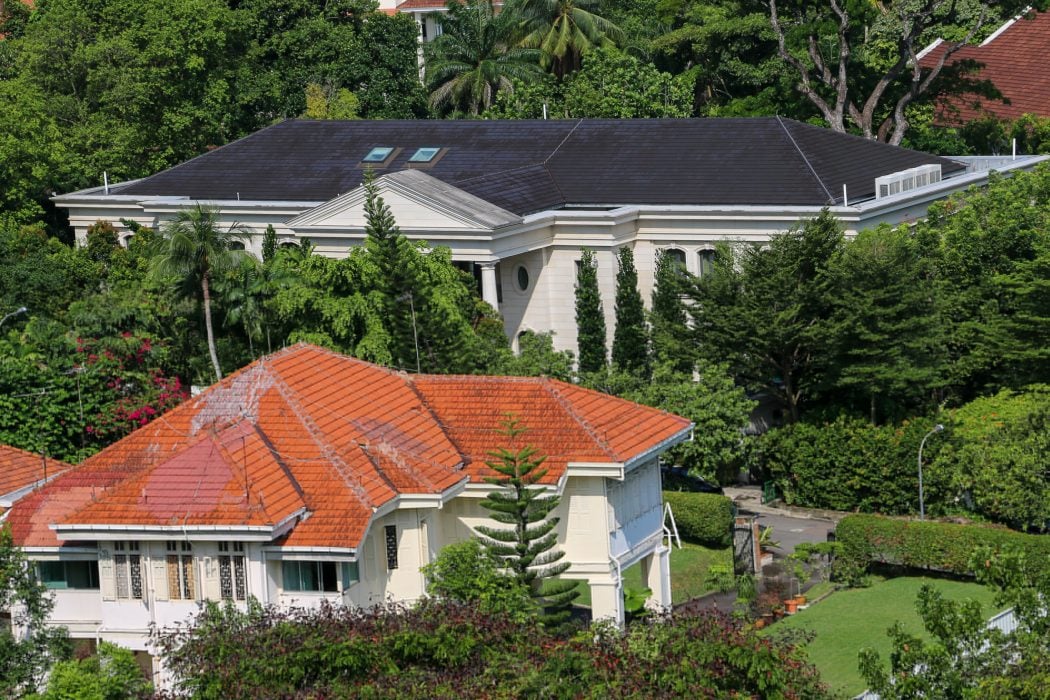
While some of them include low-lying semi-detached and cluster homes, these neighbourhoods are called GCBAs mainly because of landed properties gazetted as Good Class Bungalows or GCBs. There are roughly 2,800 GCB land plots in Singapore. To be classified as one, these historical landed houses must occupy at least 1,400 square metres (approx. 15,070 sqft) of land area and is limited to a maximum of two storeys in height.
More importantly, GCB rarity has generated unfettered demand among ultra-high-net-worth (UHNW) individuals, which in turn, raises home values of the surrounding neighbourhood.
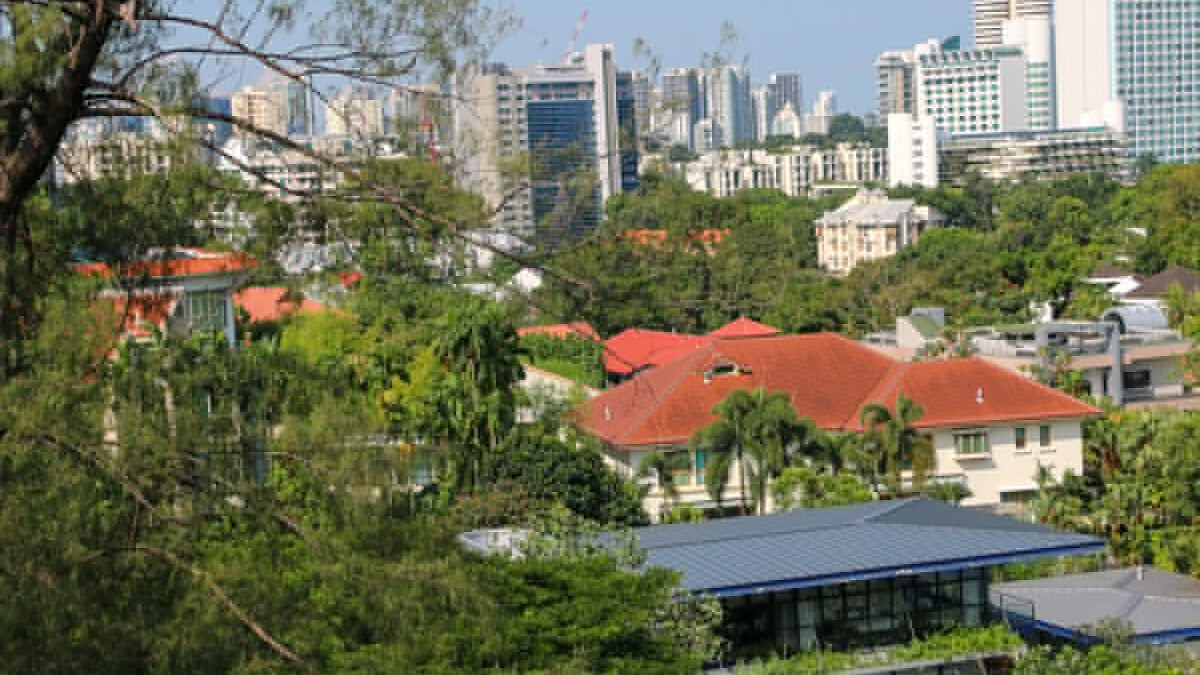
So to live within or around a GCBA is to live in an exclusive area where these UHNW individuals and their families reside, go to school, network, workout and chill out.
Note that while we use the term ‘apartments/flats’ and ‘condos’ interchangeably, there are clear distinctions between the two. The difference between apartments and condominiums is the minimum area size (1000 vs 4000 sqm) and the number of facilities (lesser for an apartment).
If you’re someone who fits this particular buyer profile, here’s a look at some low-rise apartments and full-facility condos on the fringes of several GCB Areas.
Apartments/ Condos at the fringes of GCB Areas between Coronation Road West and Holland Road
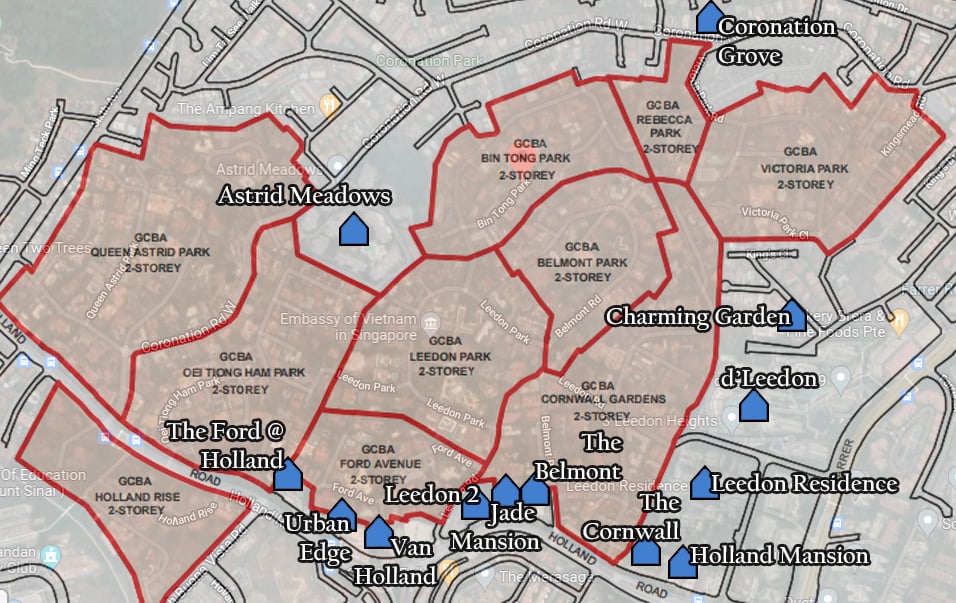
One of the largest GCBA clusters is situated between Holland Road and Coronation Road West. While the properties listed are by no means exhaustive, it’s clear that there are many condos and apartments flanking Holland Road along the southern fringes of Ford Avenue and Cornwall Gardens GCB Areas.
The following charts look at how these properties perform relative to similar properties within a 1km radius in the neighbourhood.
(All data sourced from URA, Realis and 99.co)
| Properties along Holland Road (southern fringes of Ford Avenue and Cornwall Gardens GCB Areas) | Completion | Tenure | Number of units | Average PSF Price (last 6-12 months) | Average PSF Price Growth past 15 years (Nov 2006-Oct 2021) | Average PSF Price Growth past 5 years (Nov 2016-Oct 2021) |
| Neighbourhood (all condos and apartments) | varied | Freehold | varied | S$2,200 | 114.86% | 35.09% |
| Jade Mansion | 1985 | Freehold | 27 | S$1,607.93 | 83.33% (2008-2021) | 24.44% |
| Urban Edge @ Holland V | 2007 | Freehold | 31 | S$1,780.19 | 72.51% | 34.05% |
| Leedon 2 | 1997 | Freehold | 72 | S$1,823.85 | 94.88% | 23.33% |
| The Ford@Holland | 2009 | Freehold | 85 | S$1,893.29 | 44.21% | 18.04% |
| The Belmont | 2008 | Freehold | 10 | S$1915.82 | 65.03% | 37.12% |
| Van Holland | Under development | Freehold | 69 | S$2,819.88 |
For properties to the south of Ford Avenue and Cornwall Gardens GCB Areas, their per-square-foot (psf) price growth over the past 15 and 5 years have trended as well as the neighbourhood averages. Boutique 31-unit apartment – Urban Edge @ Holland V – seems to have taken the sweet spot with its recent S$1780.19 average psf price while registering 72.51% and 34.05% average psf price growths over the last 15 and 5 years respectively.
| Properties off Farrer Road (eastern fringe of Cornwall Gardens GCB Area) | Completion | Tenure | Number of units | Average PSF Price (last 6-12 months) | Average PSF Price Growth past 15 years (Nov 2006-Oct 2021) | Average PSF Price Growth past 5 years (Nov 2016-Oct 2021) |
| Neighbourhood (all condos and apartments) | varied | varied | varied | S$2,200 | 148.73% | 39.15% |
| Holland Mansion (mostly rental transactions) | 1985 | Freehold | 117 | |||
| Charming Garden | 1987 | 999 years | 32 | S$1,500 | 44.73% | 17.55% (2017-2020) |
| d’Leedon | 2015 | 99 years | 1723 | S$1,688.02 | 7.67% (2010-2021) | 7.45% |
| The Cornwall | 2005 | Freehold | 99 | S$1,873.87 | 72.64% | 15.47% |
| Leedon Residence | 2015 | Freehold | 381 | S$2,403.59 | 19.28% (2012-2021) | 11.12% |
Moving along the eastern fringe of Cornwall Gardens GCB Area (along Farrer Road), most of the listed properties trail the neighbourhood averages by a large margin but remained mostly below the neighbourhood average price psf of S$2,200.
The higher neighbourhood averages over the last 15 and 5 years are due to developments across Farrer Road (closer to Botanic Gardens) and beyond the fringes of the GCB Area, such as Sommerville Park (TOP 1990), The Levelz (2004) and Waterfall Gardens (2010). For example, Sommerville Park had a 109.95% average price psf growth over the last 15 years and a 29.95% jump in just the last 5.
Trends-wise, it’s pretty clear that smaller apartments (100 units or lower) have registered higher double-digit average price psf growths than larger properties like d’Leedon, which usually rely more heavily on sales volume with their full-facility condominium features.
With the upcoming Van Holland on the fringe of a GCB Area and two new ones which aren’t – Hyll on Holland (319 units, TOP 2025) and Leedon Green (638 units, TOP 2023) – expect to see greater pricing dynamic changes in the neighbourhood over time.
| Properties along Coronation Road West (fringes of Queen Astrid Park, Oei Tiong Ham Park, Bin Tong Park and Rebecca Park GCB Areas) | Completion | Tenure | Number of units | Average PSF Price (last 6-12 months) | Average PSF Price Growth past 15 years (Nov 2006-Oct 2021) | Average PSF Price Growth past 5 years (Nov 2016-Oct 2021) |
| Neighbourhood (all condos and apartments) | varied | varied | varied | S$2,500 | 66.39% | 10.81% |
| Coronation Grove | 1985 | 999 years | 24 | S$1,700 (2020) | 136.82% | 24.20% (2017-2020) |
| Astrid Meadows | 1990 | Freehold | 208 | S$2,044.42 | 61.99% | 25.68% |
Farther north, Astrid Meadows and Coronation Grove have shown strong momentum in price appreciation against a more eclectic (and expensive) neighbourhood average. While both properties’ average psf prices have shown higher growths (and demand) in the last 5 years (compared to the neighbourhood average of 10.81%), the 24-unit boutique property Coronation Grove had a remarkable 136.82% growth over the last 15.
While each property has its unique pros and cons, it’s also readily apparent that residents living in these neighbourhoods, or next to GCB Areas, prize smaller, boutique properties that offer greater privacy and exclusivity (especially when it comes to sharing facilities like lifts and carparks). For some, the more recent purchase of older boutique properties could be a hopeful result of an en bloc sale, but that’s never a certainty.
Apartments/ Condos at the fringes of GCB Areas between Farrer Road and River Valley Road
Another interesting cluster of GCB Areas would be the ones between Queensway/Farrer Road and Grange/Stevens Road. These clusters surround Botanic Gardens and the start of the Orchard Road shopping belt.
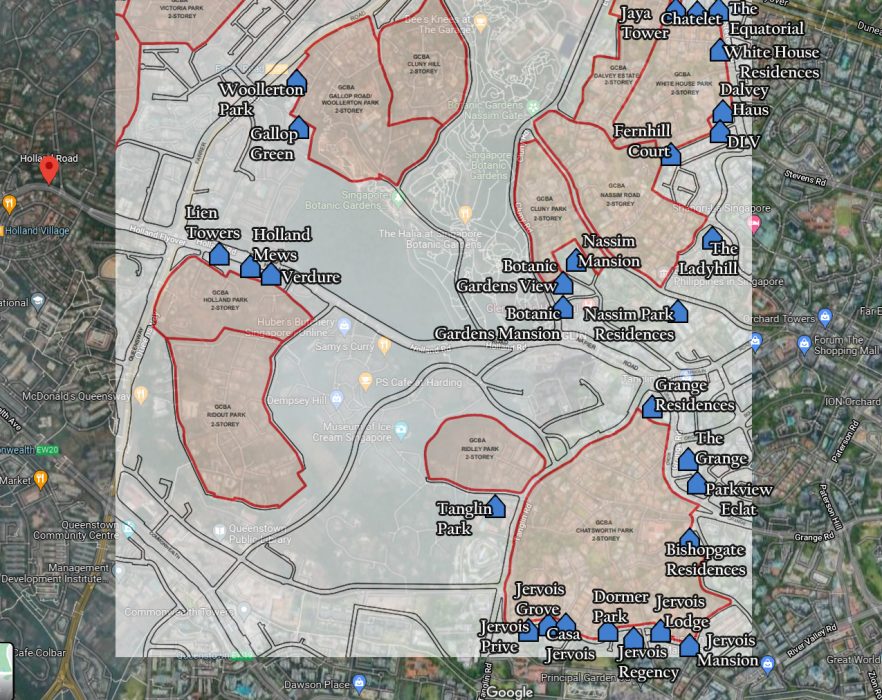
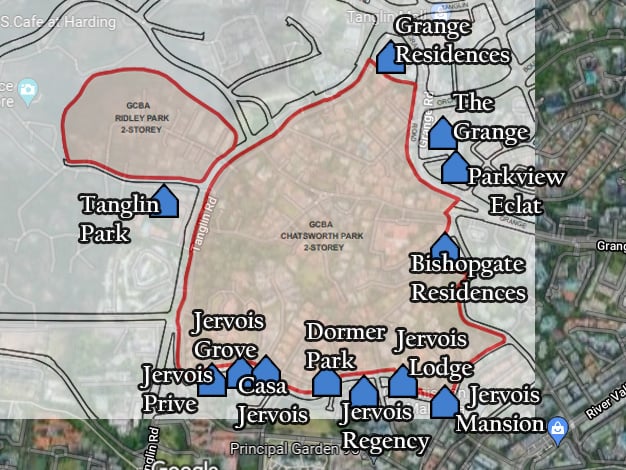
The immediate concentration of apartments along the southern border of the Chatsworth Park GCB Area / Jervois Road is obvious, where the High Commission of Malaysia is. While it’s a little too on-the-nose to have so many apartments named Jervois, collectively, they do bestow a sense of class and identity to the neighbourhood.
| Properties along Jervois Road (southern fringe of Chatsworth Park GCB Area) | Completion | Tenure | Number of units | Average Price PSF (last 6-12 months) | Average Price PSF Growth past 15 years (Nov 2006-Oct 2021) | Average Price PSF Growth past 5 years (Nov 2016-Oct 2021) |
| Neighbourhood (all condos and apartments) | varied | Freehold | varied | S$2,000 | 91.33% | 2.77% |
| Jervois Grove (mostly rental transactions) | 1986 | Freehold | 17 | S$1,300 (2013) | 10.47% (2007-2013) | |
| Casa Jervois | 1990 | Freehold | 31 | S$1,600 (2019) | 123.98% (2006-2019) | 16.50% (2016-2019) |
| Jervois Regency | 2003 | Freehold | 39 | S$1,686.26 | 136.86% | 31.96% |
| Dormer Park | 1993 | Freehold | 92 | S$1,790.63 | 113.73% | 36.03% (2017-2021) |
| Jervois Lodge | 1997 | Freehold | 108 | S$1,912.72 | 121.59% | 40.71% |
| Jervois Mansion | TOP 2026 | Freehold | 130 | S$2,580.14 | ||
| Jervois Prive | TOP 2023 | Freehold | 45 | S$2,601-S$3,130 (indicative) |
Other than Jervois Grove, which became more of a rental haven after its last 2013 sale transaction, the rest of the apartments along Jervois Road have seen average psf price increases in triple digits over the past 15 years (and high double-digits in the last 5). Not only do these figures surpass the neighbourhood average, but it also highlights the demand for new upcoming developments like Jervois Prive and Jervois Mansion.
Once again, some buyers are willing to pay more for quieter neighbourhoods, particularly if the property’s along a less-congested road.
| Properties between Grange and Nathan Road (eastern fringe of Chatsworth Park GCB Area) | Completion | Tenure | Number of units | Average PSF Price (last 6-12 months) | Average PSF Price Growth past 15 years (Nov 2006-Oct 2021) | Average PSF Price Growth past 5 years (Nov 2016-Oct 2021) |
| Neighbourhood (all condos and apartments) | varied | Freehold | varied | S$2,000 | 101.88% | 6.14% |
| The Grange | 2008 | Freehold | 95 | S$2,678.08 | 55.24% | 17.41% (2017-2021) |
| Grange Residences | 2004 | Freehold | 164 | S$2,712.42 | 47.19% | 14.65% |
| Parkview Eclat | 2009 | Freehold | 35 | S$3,132.31 | -3.86% (2007-2020) | 30.55% (2016-2020) |
| Bishopgate Residences | 2012 | Freehold | 31 | S$3,839.56 | 14.25% (2012-2021) | 10.75% |
Meanwhile, if we move north towards the eastern fringe of the Chatsworth Park GCB Area and look at properties along Grange Road and Nathan Road, the story’s a little different. After 15 years of trying to keep up with the average psf price trend of 101.88% in the neighbourhood, these listed properties have surpassed the average trend of 6.14% within the last 5.
It’s probable that after the first 10 years of hyper-growth in the area (especially with new developments), buyers are looking for resale opportunities in the area, particularly along this stretch of road. Take the 35-unit Parkview Eclat for example – after a turbulent cycle between 2007-2020, its average psf price has surged by 30.55% between 2016-2020 to S$3,132.31. One reason could be its proximity to two embassies – Egypt’s and Indonesia’s – with Tanglin Mall just a 9-minute walk away.
| Properties on the southern fringe of Ridley Park GCB Area | Completion | Tenure | Number of units | Average PSF Price (last 6-12 months) | Average PSF Price Growth past 15 years (Nov 2006-Oct 2021) | Average PSF Price Growth past 5 years (Nov 2016-Oct 2021) |
| Neighbourhood (all condos and apartments) | varied | Freehold | varied | S$1,800 | 111.01% | 14.70% |
| Tanglin Park | 1988 | Freehold | 274 | S$2,111.14 | 90.88% | 8.16% |
For Tanglin Park, it’s been trending quite similar to the neighbourhood average over the past 15 years (and last 5). Compared to other boutique apartments in the area, it is fairly large (and older). One probable reason for its price trend is it’s within 1km of Crescent Girls’ School. It’s also next to Phoenix Park, which is popular with expatriates and has a “back-lane” via Ridley Park Road into Dempsey Hill.
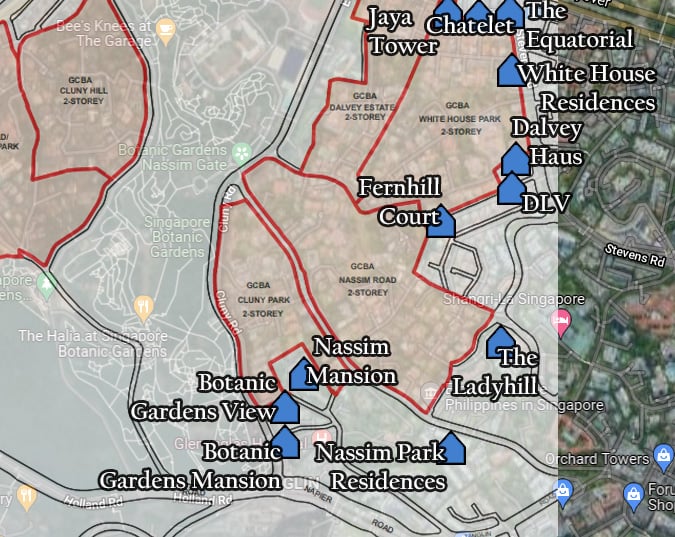
| Properties near the south-eastern fringes of Cluny Park and Nassim Road GCB Areas | Completion | Tenure | Number of units | Average PSF Price (last 6-12 months) | Average PSF Price Growth past 15 years (Nov 2006-Oct 2021) | Average PSF Price Growth past 5 years (Nov 2016-Oct 2021) |
| Neighbourhood (all condos and apartments) | varied | Freehold | varied | S$2,200 | 101.30% | 14.73% |
| Botanic Gardens Mansion | 1970 | Freehold | 112 | S$1,800 (2020) | 89.76% (2006-2020) | 21.74% (2016-2020) |
| Nassim Mansion | 1977 | Freehold | 72 | S$2,000 (2019) | -3.79% (2007-2019) | -12.29% (2017-2019) |
| The Ladyhill | 2003 | Freehold | 55 | S$2,044.50 | -33.63% | -17.97% (2016-2020) |
| Botanic Gardens View | 1970 | Freehold | 144 | S$2,313.66 | 68.37% | 53.59% |
| Nassim Park Residences | 2011 | Freehold | 100 | S$3,309.80 | 9.07% (2008-2021) | -3.98% |
Moving towards the southern fringes of the Cluny Park and Nassim Road GCB Areas, most of the properties’ last sale transactions have stayed below the S$2,000 average psf price with the exception of Botanic Gardens View and Nassim Park Residences.
Smaller freeholds like Nassim Mansion, Nassim Park Residences and The Ladyhill seem to have been struggling with negative psf pricing growth over both 5 and 15-year timeframes, while older properties, like Botanic Gardens Mansion and Botanic Gardens View have been doing amazingly well.
Notably, both Botanic Gardens properties are next to Gleneagles Hospital and within walking distance of Botanic Gardens. Also, there’s the soon-to-open Napier MRT station (est. 2022) on the Thomson East-Coast Line. These factors may have contributed to their better-than-average psf price appreciation.
| Properties beside White House Park GCB Area | Completion | Tenure | Number of units | Average PSF Price (last 6-12 months) | Average PSF Price Growth past 15 years (Nov 2006-Oct 2021) | Average PSF Price Growth past 5 years (Nov 2016-Oct 2021) |
| Neighbourhood (all condos and apartments) | varied | Freehold | varied | S$2,200 | 104.64% | 26.20% |
| DLV | 2005 | Freehold | 25 | S$1,300 (2020) | 52.43% (2006-2020) | 1.39% (2017-2020) |
| Fernhill Court | 1981 | Freehold | 18 | S$1,500 (2016) | 14.64% (2007-2016) | |
| Chatelet | 1993 | Freehold | 45 | S$1,769.92 | 128.13% | 24.62% |
| The Equatorial | 2002 | Freehold | 95 | S$1,884.12 | 93.23% | 20.01% |
| Jaya Tower | 1979 | Freehold | 28 | S$2,000.99 | 133.19% (2007-2021) | 31.88% |
| White House Residences (mostly rental transactions) | 2013 | Freehold | 12 | S$2,300 (2014) | ||
| Dalvey Haus | TOP TBC | Freehold | 27 | S$2,960 |
Up along the eastern fringe of White House Park GCB Area, properties like Fernhill Court and DLV had their last sale transactions in 2016 and 2020 respectively. Fernhill Court, which tried to en bloc in 2018, is now seeing mostly rental transactions.
Similarly, White House Residences, a mix of strata landed and condo units, has seen mostly rental transactions since 2014. It would be interesting to see how Dalvey Haus, the former Villa D’Este site, perform over the next couple of years once it is completed.
Bucking the neighbourhood trend however are the properties on the northern fringe of White House Park GCB Area, namely The Equatorial, Chatelet and Jaya Tower. All three overlook the junction of Dunearn/Bukit Timah and Steven Roads (where Raffles Town Club is) and are within walking distance of Singapore Chinese Girl’s School and Stevens MRT.
Despite being one of the oldest properties listed, Jaya Tower remains resilient enough to outperform the rest. We note that its north, west and south-facing views are all unblocked due to the GCB Area.
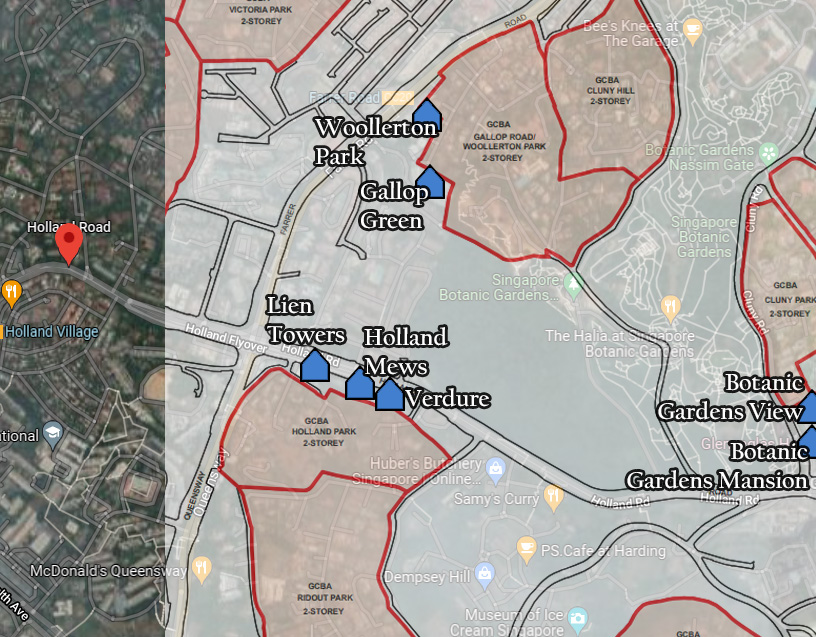
| Properties near Gallop Road/Woollerton Park and Holland Park GCBAs | Completion | Tenure | Number of units | Average Price PSF (last 6-12 months) | Average Price PSF Growth past 15 years (Nov 2006-Oct 2021) | Average Price PSF Growth past 5 years (Nov 2016-Oct 2021) |
| Neighbourhood (all condos and apartments) | varied | Freehold | varied | S$2,400 | 172.45% | 35.78% |
| Holland Mews | 2004 | Freehold | 21 | S$1,231.14 | 27.92% | -10.95% |
| Lien Towers | 1970 | Freehold | 24 | S$1,657.13 | 68.34% (2007-2021) | -11.95% (2011-2021) |
| Woollerton Park | 2002 | Freehold | 72 | S$1,750 (2020) | 33.33% (2007-2020) | 11.42% (2016-2020) |
| Verdure | 2012 | Freehold | 75 | S$1,838.61 | 19.13% (2009-2021) | -5.03% |
| Gallop Green | 2002 | Freehold | 53 | S$2,116.19 | 37.51% (2009-2021) | 20.93% |
In the area between Holland Park and Gallop Road/Woollerton Park GCB Areas, we’ve highlighted some properties near their fringes.
Most are older properties with lower psf prices compared to the neighbourhood average. The newer condo/apartment developments can be found where Farrer Road meets Bukit Timah Road, or at the junction of Holland Road and Farrer Road (away from the GCBA fringes), such as Pollen & Bleu, Cluny Park Residence and The Asana.
Woollerton Park and Gallop Green – both 19 years old and sit at the western fringe of Gallop Park/Woollerton Park GCB Area, seem to do better than the ones near Holland Park GCB Area. They’ve registered average psf price growths of 30+% in the last 12-14 years and 11-21% in the last 5. Signals of en bloc potentials perhaps?
Apartments/ Condos / Cluster Houses at the fringes of GCB Areas near Bukit Timah/Dunearn Road
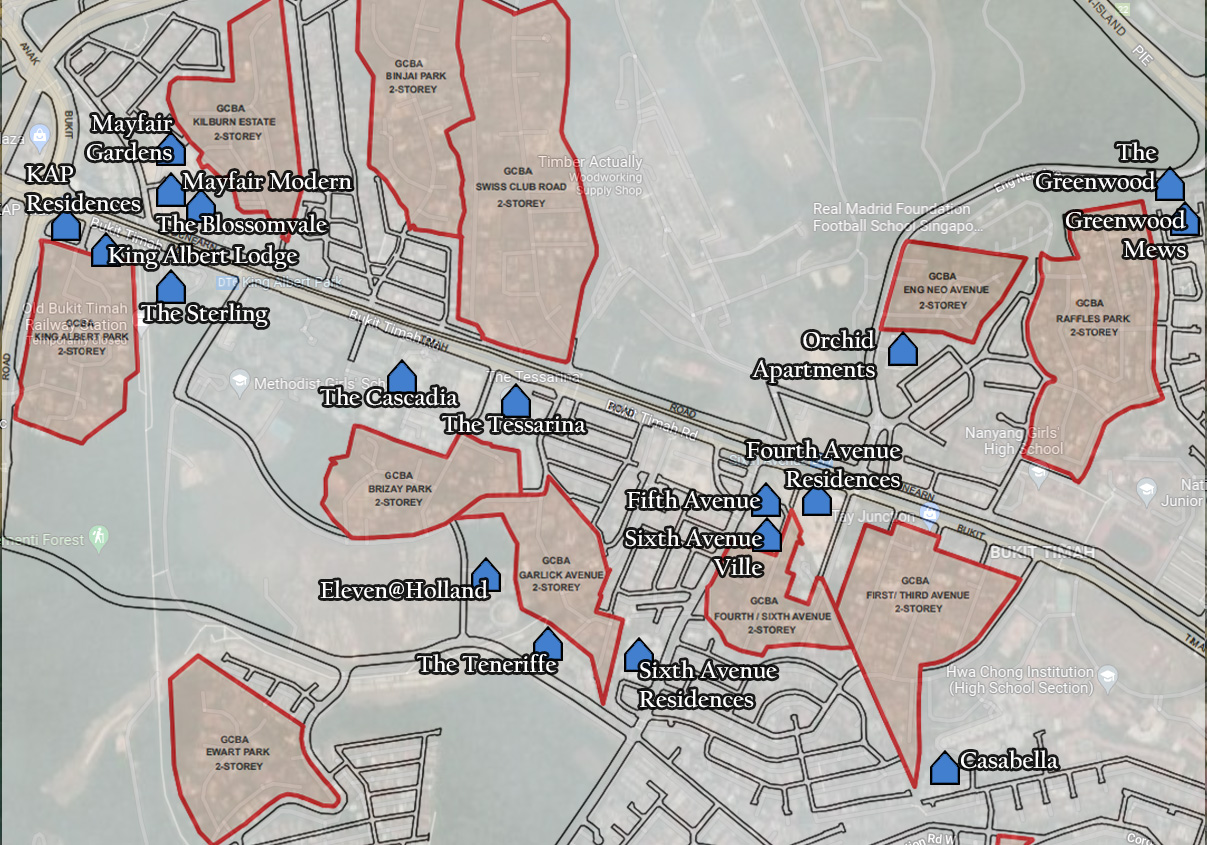
Finally, a third major cluster we’ll be examining will be properties by the fringes of GCB Areas straddling both sides of the Bukit Timah/Dunearn Roads. Besides being next to two of the busiest roads in Singapore, they’re mostly near popular Bukit Timah schools and offer walking access to the Rail Corridor and quick drives into the city.
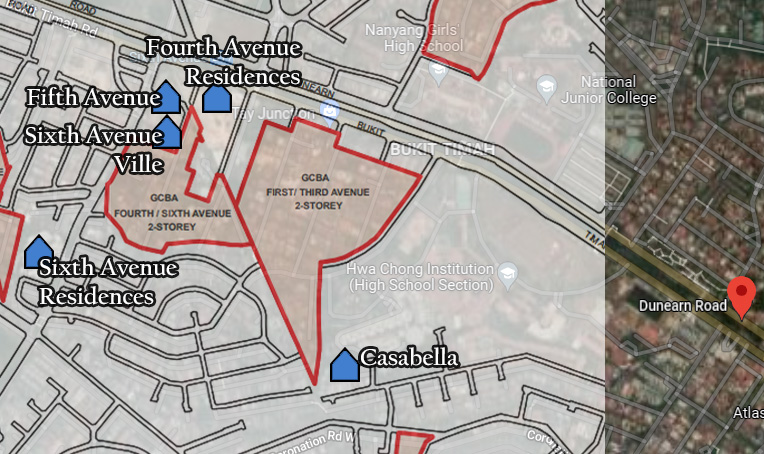
| Properties around First/Third and Fourth/Sixth Avenue GCB Areas | Completion | Tenure | Number of units | Average Price PSF (last 6-12 months) | Average Price PSF Growth past 15 years (Nov 2006-Oct 2021) | Average Price PSF Growth past 5 years (Nov 2016-Oct 2021) |
| Neighbourhood (all condos and apartments) | varied | varied | varied | S$2,300 | 139.19% | 66.13% |
| Casabella | 2005 | Freehold | 82 | S$1,575.90 | 34.62% (2007-2021) | 46.18% |
| The Sixth Avenue Residences | 2009 | Freehold | 175 | S$1632.12 | 61.36% | 21.53% |
| Sixth Avenue Ville | 1999 | Freehold | 49 | S$1740.65 | 143.82% | 26.26% |
| Fifth Avenue | 1998 | Freehold | 70 | S$1857.36 | 54.51% (2007-2021) | 15.37% (2017-2021) |
| Fourth Avenue Residences | TOP 2022 | 99 years | 476 | S$2,422.19 |
First up, these properties are closest to schools like Nanyang Girls High School, National Junior College and Hwa Chong Institution. Overlooking the First/Third Avenue and Fourth/Sixth Avenue GCB Areas, it looks like most of them have seen consistent average psf prices, at least in the past 5 years.
Sixth Avenue Ville had a good run in the last 15 with a 143.82% appreciation, but it’s Casabella that has seen its average psf price surge by almost 50% recently. The 82-unit apartment includes townhouses and strata semi-detached units, which may be popular with larger families. The site is also next door to Hwa Chong Institution and overlooks the Namly Park landed housing neighbourhood.
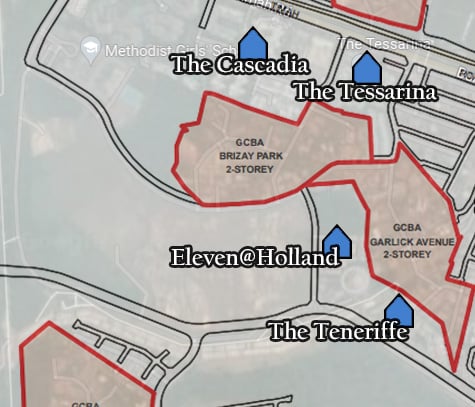
| Properties around Brizay Park and Garlick Avenue GCB Areas | Completion | Tenure | Number of units | Average Price PSF (last 6-12 months) | Average Price PSF Growth past 15 years (Nov 2006-Oct 2021) | Average Price PSF Growth past 5 years (Nov 2016-Oct 2021) |
| Neighbourhood (all condos and apartments) | varied | varied | varied | S$2,250 | 148.52% | 64.18% |
| Eleven@Holland (cluster home) | 2014 | 99 years | 82 | S$736.08 | -28.96% (2011-2021) | -3.10% (2018-2021) |
| The Teneriffe (cluster home) | 2004 | 99 years | 148 | S$900.18 | 71.57% | 5.22% |
| The Cascadia | 2011 | Freehold | 536 | S$1794.82 | 15.34% (2007-2021) | 35.86% |
| The Tessarina | 2003 | Freehold | 443 | S$1966.59 | 139.80% | 27.25% |
Farther west, we thought we include some cluster home developments for comparisons to the neighbourhood. Even so, the averages underperform against the neighbourhood’s, which includes properties along the main roads. One reason could be these properties are as remotely located as Brizay Park and Garlick Avenue GCB Areas.
Between the two condominiums featured – The Cascadia has had a slightly better appreciation in average psf pricing in the past 5 years compared to The Tessarina (which had an impressive 140% jump over the last 15). Both are facing the main Bukit Timah Road.
Still, it is properties like Villa Azura (53 units), the upcoming Royalgreen (TOP 2025, 285 units) and many more developments concentrated along the main roads, that will continue to drive more of the neighbourhood averages upwards.
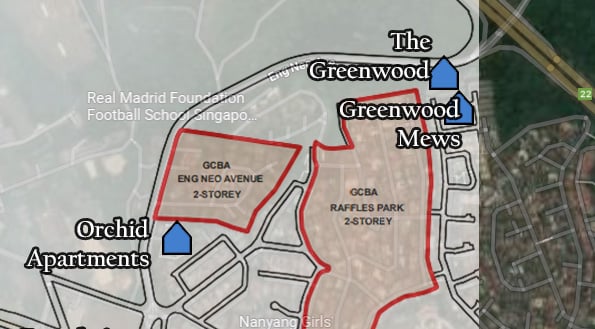
| Properties around Eng Neo Avenue and Raffles Park GCB Areas | Completion | Tenure | Number of units | Average Price PSF (last 6-12 months) | Average Price PSF Growth past 15 years (Nov 2006-Oct 2021) | Average Price PSF Growth past 5 years (Nov 2016-Oct 2021) |
| Neighbourhood (all condos and apartments) | varied | varied | varied | S$2,200 | 224.56% | 127.99% |
| Greenwood Mews (cluster home) | 2016 | 103 years | 62 | S$1250 | 14.14% (2012-2020) | 17.49% (2015-2020) |
| The Greenwood (cluster home) | 2011 | 103 years | 54 | S$1523.39 | 13.94% | 9.38% |
| Orchid Apartments | 1977 | Freehold | 52 | S$1557.25 | 78.57% (2007-2021) | 25.87% (2017-2021) |
To the northeast of the cluster, there isn’t that many condos or apartments next to the Eng Neo Avenue or Raffles Park GCB Area.
The larger developments – like Hillcrest Arcadia (272 units), The Arcadia (164) and Watten Hill (70), are located closer to the Adam Road/PIE exit, rather than near these GCB Areas.
The exclusivity and short supply of apartments in the neighbourhood might explain the positive trends even for the two cluster homes highlighted here.
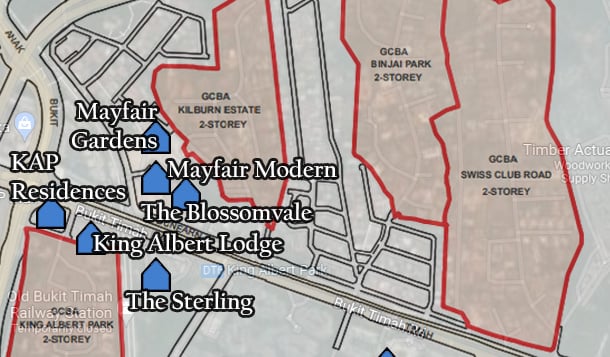
| Properties at the fringes of King Albert Park and Kilburn Estate GCB Areas | Completion | Tenure | Number of units | Average Price PSF (last 6-12 months) | Average Price PSF Growth past 15 years (Nov 2006-Oct 2021) | Average Price PSF Growth past 5 years (Nov 2016-Oct 2021) |
| Neighbourhood (all condos and apartments) | varied | varied | varied | S$1700 | 127.87% | 31.25% |
| The Blossomvale | 1999 | 999 years | 220 | S$1665.70 | 180.57% | 28.95% |
| King Albert Lodge | 1997 | Freehold | 101 | S$1698.62 | 88.41% (2007-2021) | 44.45% |
| KAP Residences | 2016 | Freehold | 142 | S$1715.73 | -1.87% (2013-2021) | 11.65% (2018-2021) |
| The Sterling | 2001 | Freehold | 232 | S$1879.77 | 165.53% | 37.09% |
| Mayfair Gardens | TOP 2024 | 99 years | 215 | S$2,026.98 | ||
| Mayfair Modern | TOP 2024 | 99 years | 171 | S$2,078.06 |
Finally, closer to the Jalan Anak Bukit junction, older properties like King Albert Lodge and The Sterling have kept to the neighbourhood momentum in terms of average psf prices.
While being close to the King Albert Park GCB Area has its benefits, they’re also next to mixed-use KAP Residences (which used to be the old McDonald’s HQ), Ngee Ann Polytechnic and the Rail Corridor in their backyards.
However, the star seems to be the trail-blazer across the road, The Blossomvale, which is next to Kilburn Estate GCB Area. It surpassed the neighbourhood average over the past 15 years and is not too far off from the last 5. This bodes well for new developments Mayfair Modern and Mayfair Gardens, which are also next to the GCB Area.
–
What are your thoughts on living near a GCB Area? Let us know in the comments section below or on our Facebook post.
If you found this article helpful, 99.co recommends Les Maisons Nassim penthouse sold for S$75m, possibly the most expensive apartment ever sold in Singapore and Good Class Bungalow (GCB) house-hunting: Confessions from agents.
Looking for a property? Find the home of your dreams today on Singapore’s fastest-growing property portal 99.co! If you would like to estimate the potential value of your property, check out 99.co’s Property Value Tool for free. Meanwhile, if you have an interesting property-related story to share with us, drop us a message here — and we’ll review it and get back to you.

About Terence Ang
Terence edits and writes about the real estate industry, including Singapore property trends, regulations and home-buying journeys. Other than writing, he also edits other writers' work and oversees the day-to-day operations of 99.co's Insider sections.
Looking to sell your property?
Whether your HDB apartment is reaching the end of its Minimum Occupation Period (MOP) or your condo has crossed its Seller Stamp Duty (SSD) window, it is always good to know how much you can potentially gain if you were to list and sell your property. Not only that, you’ll also need to know whether your gains would allow you to right-size to the dream home in the neighbourhood you and your family have been eyeing.
One easy way is to send us a request for a credible and trusted property consultant to reach out to you.
Alternatively, you can jump onto 99.co’s Property Value Tool to get an estimate for free.
If you’re looking for your dream home, be it as a first-time or seasoned homebuyer or seller – say, to upgrade or right-size – you will find it on Singapore’s fastest-growing property portal 99.co.
Meanwhile, if you have an interesting property-related story to share with us, drop us a message here — and we’ll review it and get back to you.
Join our social media communities!
Facebook | Instagram | TikTok | Telegram | YouTube | Twitter


Leave a comment